
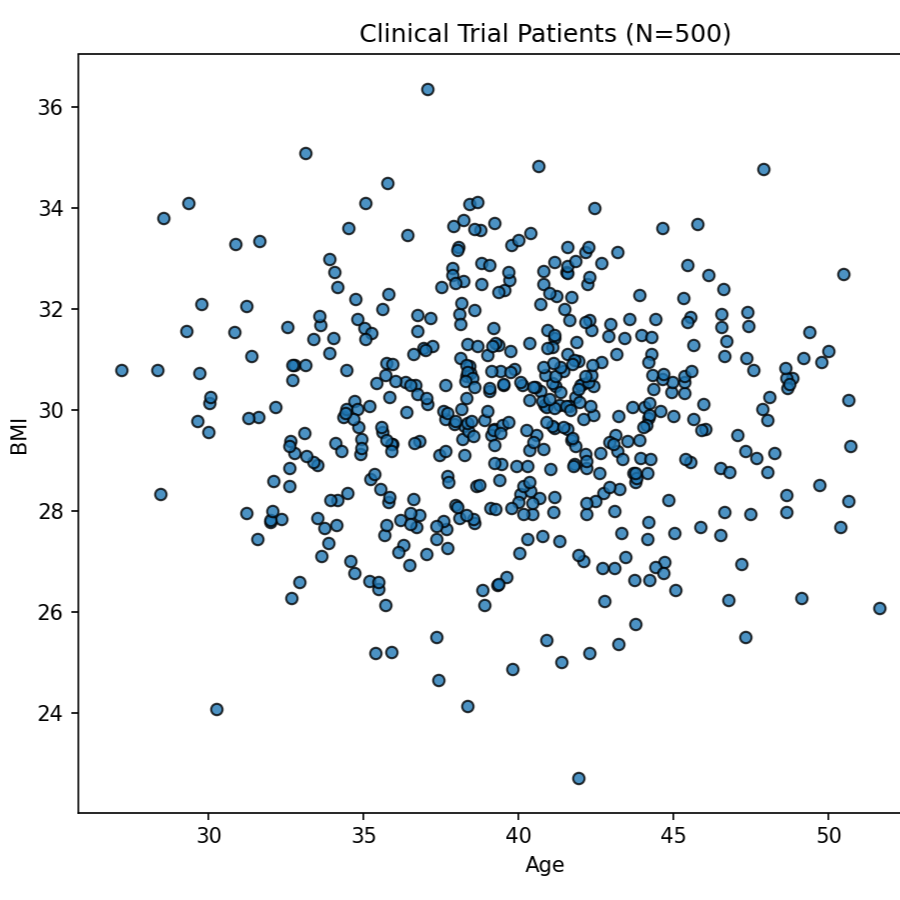
Patient distribution — age vs. BMIScatter plot of 500 clinical trial patients. Most cluster around age 40 and BMI 30, revealing the core demographic structure of the trial population.
Patient distribution — age vs. BMI